CloudWatch:
Amazon CloudWatch is a monitoring and observability service provided by Amazon Web Services (AWS). It helps you collect and track metrics, collect and monitor log files, set alarms, and automatically react to changes in your AWS resources. CloudWatch provides insights into the performance, operational health, and resource utilization of your AWS infrastructure and applications.
Steps:
Step 2:Dynamically install AWS CloudWatch-Agent through Auto Scaling Groups
Step 3: Monitoring Metrics and Logs of AWS EKS cluster
Key features of Amazon CloudWatch include:
Metrics: CloudWatch collects and stores data in the form of metrics. These metrics represent various aspects of your AWS resources, such as CPU utilization, network activity, and disk I/O.
Alarms: You can set up alarms based on CloudWatch metrics to notify you when certain thresholds are breached. Alarms can trigger actions, such as sending notifications or automatically scaling resources.
Dashboards: CloudWatch allows you to create customized dashboards to visualize and analyze your metrics. You can combine multiple metrics on a single dashboard to get a comprehensive view of your system’s performance.
Logs: CloudWatch Logs enables you to collect, monitor, and analyze log files from your applications and resources. This helps in troubleshooting and debugging issues within your environment.
Events: CloudWatch Events allow you to respond to changes in your AWS resources. You can set up rules to trigger automated actions when specific events occur.
Synthetics: CloudWatch Synthetics allows you to monitor the performance of your applications by creating canaries. Canaries are configurable scripts that simulate user interactions with your application.
Container Insights: CloudWatch provides insights into the performance and health of your containerized applications by collecting and visualizing metrics from services like Amazon ECS and EKS.
CloudWatch is a versatile service that plays a crucial role in managing, monitoring, and maintaining the health of your AWS infrastructure and applications. It is an essential tool for cloud-based environments, providing visibility into various aspects of your resources and helping you ensure the reliability and performance of your applications.
Step 1:Launch an EC2 instance and install CloudWatch-Agent to accces the logs of instance(static way)
Navigate to All services >> EC2 >> Launch instance with Amazon linux AMI >> Attach an IAM role with Admin access
SSH into the machine and follow the below commands to install AWS CloudWatch-Agent
By default cloudwatch can be used to monitor the resources metrics on AWS but cannot access the application logs, so to do that we need to install AWS CloudWatch-Agent
cloudwatch agent in ec2 instance
sudo yum install amazon-cloudwatch-agent -y
config cloud-watchagent
sudo /opt/aws/amazon-cloudwatch-agent/bin/amazon-cloudwatch-agent-config-wizard
Go with the default inputs for configuration and for collectD give NO
To monitor specific logs of application deployed on webservers we can give respective locations of the directories where logs are stored
here since we are working on nginx webserver the file locations are used from below
/var/log/nginx/access.log
/var/log/nginx/error.log
start the cloud watch agent
sudo /opt/aws/amazon-cloudwatch-agent/bin/amazon-cloudwatch-agent-ctl -a fetch-config -m ec2 -c file:/opt/aws/amazon-cloudwatch-agent/bin/config.json -senable cloudwatch agent to start on boot
sudo /opt/aws/amazon-cloudwatch-agent/bin/amazon-cloudwatch-agent-ctl -a append-config -m ec2 -c file:/opt/aws/amazon-cloudwatch-agent/bin/config.json -scheck status
sudo /opt/aws/amazon-cloudwatch-agent/bin/amazon-cloudwatch-agent-ctl -m ec2 -a status
After successfully configuring CloudWatch-Agent and installation we should be able to access the logs and metrics of instance in AWS CloudWatch directly on AWS console
Navigate to All services >> CloudWatch >> Create a Dashboard with required fields to monitor from the instance which we are working on(you can also check for instance metrics and logs with instance id if you cannot find fields directly).
Step 2:Dynamically install AWS CloudWatch-Agent through Auto Scaling Groups
To collect operating system-level metrics like available and used memory, you must install the CloudWatch agent. You can use the CloudWatch agent to collect both system metrics and log files from Amazon EC2 instances.
When working on 3-tier web application Deployment or more with having micro service-architecture, its not possible to install CloudWatch-Agent on instances since Instances gets Scaled up and down by ASG.
Once your Application Service is deployed on server then install CloudWatch-Agent and then create an image from that instance you can ref here for that and make sure you have installed CloudWatch-Agent for frontend and check for step 2.1 from below.
Similarly do it for backend and create an image and can follow the same steps as shown here
2.1)Enable detailed monitoring and attach IAM role (console):
By default, basic monitoring is enabled when you use the AWS Management Console to create a launch template or launch configuration.
When you create the launch template using the AWS Management Console, in the Advanced details section, for Detailed CloudWatch monitoring, choose Enable, and also select IAM role to be attached to instances i.e Role with Admin access. Otherwise, basic monitoring is enabled. For more information, see Create a launch template using advanced settings and choose the below as shown in ss.

2.2)Monitoring metrics and logs of Application created though ASG on Cloudwatch:
You can now monitor the behavior of resources
Navigate to All services >> CloudWatch >> Create a Dashboard with required fields to monitor from the instance which we are working on >> add Widget >> select type >> select fields you want (you can also check for instance metrics and logs with instance id if you cannot find fields directly).
Your Dashboard will be ready and to monitor logs you can navigate to Log groups on samescreen.

Step 3: Monitoring Metrics and Logs of AWS EKS cluster
Monitoring of EKS cluster can be done in many ways, directly by using EKS add-on Services where we can use CloudWatch, Grafana and manymore monitoring tools directly installed on EKS cluster and they are managed directly by Cluster.
Here we will be using EKS CLoudWatch add-on to monitor the logs and metrics of cluster.
3.1)Install the CloudWatch agent by using the Amazon CloudWatch Observability EKS add-on on EKS cluster:
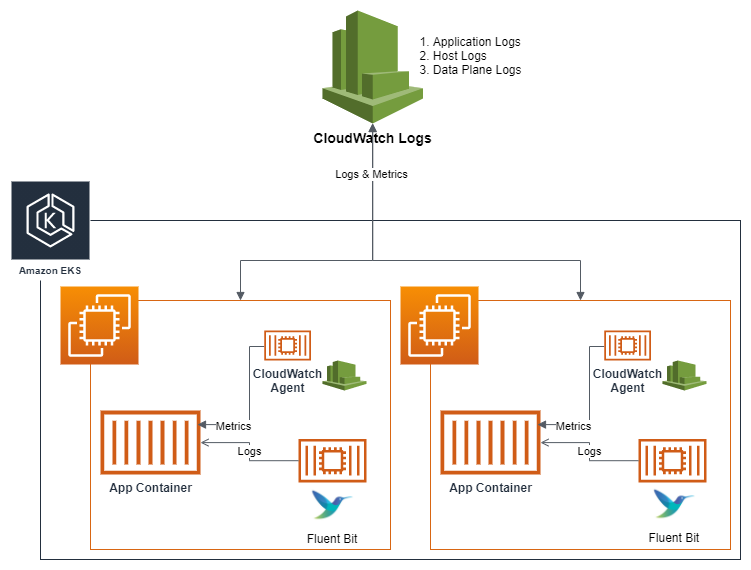
The Amazon CloudWatch Observability EKS add-on installs the CloudWatch Agent and the Fluent-bit agent on an Amazon EKS cluster, with Container Insights enhanced observability for Amazon EKS and CloudWatch Application Signals enabled by default. Using the add-on, you can collect infrastructure metrics, application performance telemetry, and container logs from the Amazon EKS cluster.
The Amazon CloudWatch Observability EKS add-on is supported on Amazon EKS clusters running with Kubernetes version 1.23 or later.
First refer here for understanding creation of EKS cluster and nodes.
Attach the below IAM policies to your worker nodes refer here for creating an IAM role for worker nodes
CloudWatchAgentServerPolicy,
AWSXrayWriteOnlyAccess
On the EKS cluster where you deployed your application you should install the Amazon CloudWatch Observability EKS add-on.
To use the Amazon EKS console to add the Amazon CloudWatch Observability EKS add-on follow the below steps:
- Open the Amazon EKS console at https://console.aws.amazon.com/eks/home#/clusters.
- In the left navigation pane, choose Clusters.
- Choose the name of the cluster that you want to configure the Amazon CloudWatch Observability EKS add-on for.
- Choose the Add-ons tab.
- Choose Get more add-ons.
- On the Select add-ons page, do the following:
- In the Amazon EKS-addons section, select the Amazon CloudWatch Observability check box.
- Choose Next.
- On the Configure selected add-ons settings page, do the following:
- Select the Version you’d like to use.
- For Select IAM role, select Inherit from node
- Choose Next.
- On the Review and add page, choose Create. After the add-on installation is complete, you see your installed add-on.

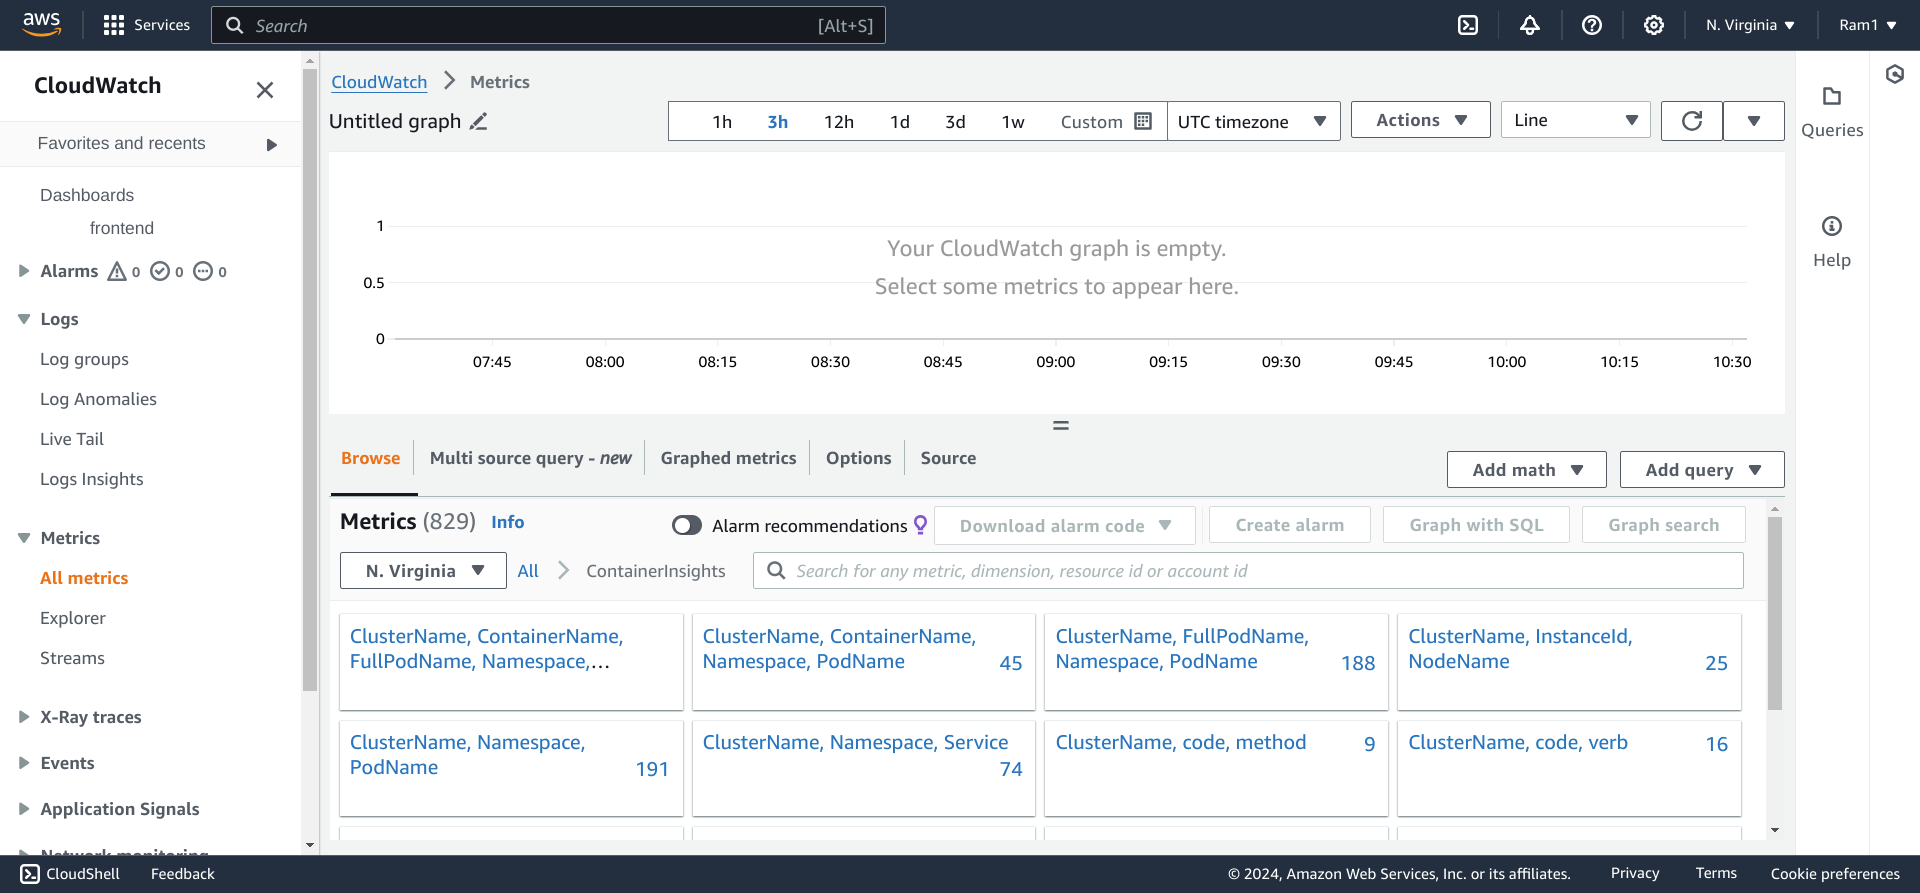
Now you can monitor the Logs, Metrics and Insights of containers running EKS cluster on AWS CloudWatch from AWS console.