What is static code analysis?
In computer science, static program/code analysis is the analysis of computer programs performed without executing them, in contrast with dynamic program analysis, which is performed on programs during their execution.
What is SonarQube
SonarQube is an open-source platform developed by SonarSource.
It is used for static analysis of code and provides a detailed report to detect bugs, code smells, and security vulnerabilities in 20+ programming languages, like -java, C. .
SonarQube reduces the risk of software development within a very short amount of time. It also detects bugs in the code automatically and alerts developers to fix them before rolling it out for production. It helps to highlight the complex areas of code that are less covered by unit tests.
Why use SonarQube?
SonarQube improves productivity by enabling development teams to identify and muzzle redundancy and duplication of code. SonarQube makes it easier for team members to decrease application size, code complexity, time and cost of maintenance, and make code easier to read and understand.
What languages does SonarQube support?
SonarQube includes support for the programming languages such as Java (including Android), C/C++, C#, TypeScript, JavaScript, Go, Swift, Python, COBOL, Apex, PHP, Ruby, Kotlin, HTML, CSS, ABAP, Scala, Objective-C, PL/I, PL/SQL, Flex, RPG, T-SQL, VB.NET, VB6, and XML.
What are the advantages of using SonarQube?
SonarQube is open source
SonarQube supports for various languages like Java, C#
SonarQube reports for duplicate code, unit testing, code coverage, code complexity historical
We can integrate SonarQube with build tools like ant, gradle
SonarQube has Eclipse plugin like Sonarlint
SonarQube supports external plugins like plugin for ldap
Why do you think that we should use SonarQube over other Code Quality Tools?
There are various reasons to use SonarQube and not other code quality solutions. This includes but is not restricted to:
No need for an IDE – any language supported.
Supports dynamic languages such as Python, JavaScript, and Ruby.
Explain the difference between SonarLint and SonarQube?
SonarQube:
SonarQube is the main server that performs complete analysis (activated by the different SonarQube scanners).
The analysis is to provide your code base a 360 ° view of the quality. To this end, it periodically analyzes each source line of your project.
SonarLint:
SonarLint is available only in the IDE (IntelliJ, Visual Studio and Eclipse).
Its objective is to offer immediate feedback as you enter your code.
It concentrates on what code you specify or modify for this function.
SonarLint is an agent that enables us to connect with SonarQube and executes the analysis remotely.
Both SonarQube and SonarLint are dependent on the same analyzers for static source code, most of which is written using SonarSource technology.
Explain, what are the prerequisite for SonarQube Installation
Following are the prerequisites for SonarQube Installation (CHECK ANSWER)
DOTNET
Php
Java
JavaScript
List the components in SonarQube architecture
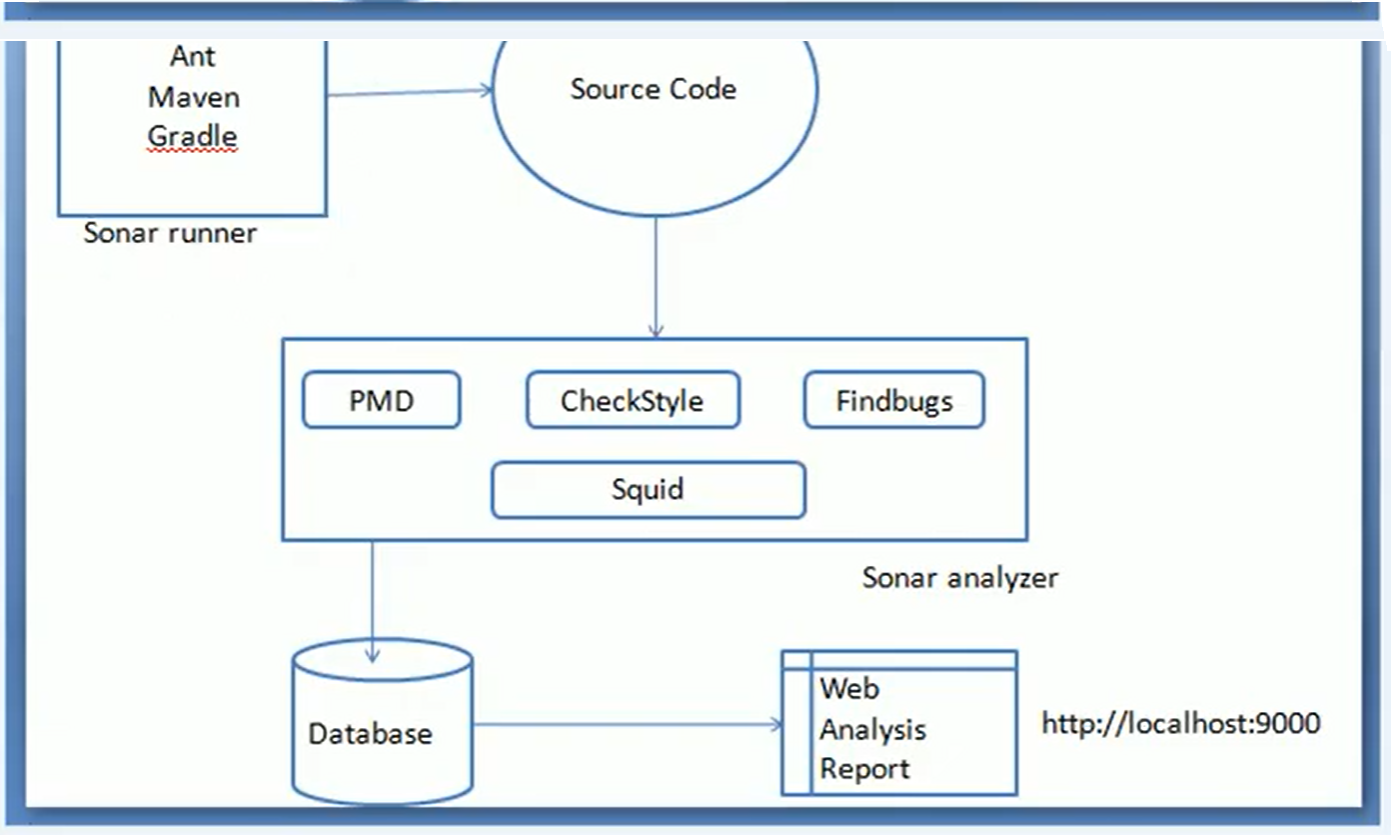
The components of the SonarQube architecture are:
Sonar Analyzer
SonarQube Database
Source Code
Sonar Scanner
Explain architecture of SonarQube?
What is role of database in SonarQube?
SonarQube needs to communicate with the database to save the results of the analysis. The SonarQube Runner needs to interact with both the web server and the database and is suggested as the default launcher to analyze a project with SonarQube. This means all the passwords should be stored in the database.
What is the difference between Sonar Runner and Sonar Scanner?
“Runner” is the old name for “Scanner”. All you need to know about the different SonarQube Scanners is present in the Scanners section of the official documentation. You can use the following option, if you are stuck on Java 7:
SonarQube Runner (sonar-runner) up to version 5.5 of SonarQube.
SonarQube Scanner (sonar-scanner) 2.6.1.
What are Quality Profiles in SonarQube?
The Quality Profiles service is central to SonarQube, since it is where you define your requirements by defining sets of rules (ex: Methods should not have a Cognitive Complexity greater than 15).
Ideally, all projects will be measured with the same profile for any given language, but that’s not always practical. For instance, you may find that:
The technological implementation differs from one application to another (for example, different coding rules may apply when building threaded or non-threaded Java applications). You want to ensure stronger requirements on some of your applications (internal frameworks for example).
What are Quality Gates in SonarQube?
A quality gate is the best way to enforce a quality policy in your organization. It’s there to answer ONE question: can I deliver my project to production today or not? In order to answer this question, you define a set of Boolean conditions based on measure thresholds against which projects are measured. For example:
No new blocker issues Code coverage on new code greater than 80% Etc. Ideally, all projects will be verified against the same quality gate, but that’s not always practical. For instance, you may find that: Technological implementation differs from one application to another (you might not require the same code coverage on new code for Web or Java applications). You want to ensure stronger requirements on some of your applications (internal frameworks for example). Etc.
Which is why you can define as many quality gates as you wish. Quality Gates are defined and managed in the Quality Gates page found in the top menu.
Explain the term RULES with respect to SonarQube.
SonarQube runs rules on source code to create issues. There are four types of rules/issues:
Bugs, Vulnerability, Code-Smells, Security Hotspot. (coverage, duplications)
For Bugs and code smells, zero false positives are anticipated. This is the target so that developers do not have to wonder if a fix is required.
For Vulnerabilities, the aim is to have more than 80% of issues be true positives.
Security Hotspot rules focus on attention to code that is security sensitive. It is predicted that more than 80% of the issues will be easily resolved as “Reviewed” after review by a developer.
Explain the term code smell with respect to SonarQube
Code smell is a maintainability-related issue in the code. Leaving it as-is means that at best maintainers are bound to have a tougher time than they should while making changes to the code. At worst, they can get so confused by the state of the code that they may end up introducing additional errors as they make modifications.
How to create reports in SonarQube?
To create reports using SonarQube
mvn clean install
mvn sonar:sonar -Dsonar.issuesreport.html.enable=true
Explain how I can delete a project from SonarQube.
Following are the steps to delete a project from SonarQube:
Login to the system as an administrator.
Select to Administration -> Projects -> Projects Management.
Select the Project(s) you would like to Delete.
Select the Delete option available at the top right corner.
Explain the steps to trigger a full ElasticSearch reindex in SonarQube?
Following are the steps to force a reindex:
Stop the server
Delete the contents of the $SQ_HOME/data/es7 directory
Start the server
However, ensure that you are aware of the processes in place on the SonarQube and also that a full re-index can be quite lengthy depending on the size of your instance?
When a resolved issue does not get corrected, what is the status it gets into automatically?
When a resolved issue does not get corrected, the status automatically gets set to “reopened”.
What is Jacoco?
JaCoCo is an open-source toolkit for measuring code coverage in a code base and reporting it via visual reports.
It is quite popular among a variety of code coverage frameworks. It measures line and branch coverage based on the code covered by the running unit test cases and provides a visual report, including the highlighted lines of code and the total percentage of code executed in each method.
The developer can assess code that has not been adequately tested from this analysis. It’s best to focus on areas where coverage is particularly low and try to analyze why this code hasn’t been thoroughly tested.
Jacoco runs as a Java Agent. Jacoco is an open-source project that can be used to test production code for test code coverage. It generates reports and integrates well with IDEs like Eclipse IDE. Integration is also available for other IDEs and Continuous Integration environments.
JaCoCo saves the developer’s time by pinpointing the exact location where the code coverage is low, providing a more specific area to focus on. The JaCoCo tests do not take long at all to generate as they are created while your unit tests are running.
What is the difference between JaCoCo and SonarQube?
JaCoCo: A code coverage library for Java. It is a free code coverage library for Java, which has been created based on the lessons learned from using and integration existing libraries for many years.
SonarQube: Continuous Code Quality. SonarQube provides an overview of the overall health of your source code and even more importantly, it highlights issues found in new code. With a Quality Gate set on your project, you will simply fix the Leak and start mechanically improving.
How do you increase code coverage?
Improving Test Coverage
Write More Tests.
Generate Tests Automatically.
Remove Dead/Zombie Code.
Remove Redundant/Cloned Code.
Write/Execute More Sophisticated Tests.
How to generate-codecoverage-report-with-jacoco-and-sonarqube
A code coverage metric tells you what percentage of your production code is covered by tests. The higher the better.
Jacoco is a tool which generates such metrics.
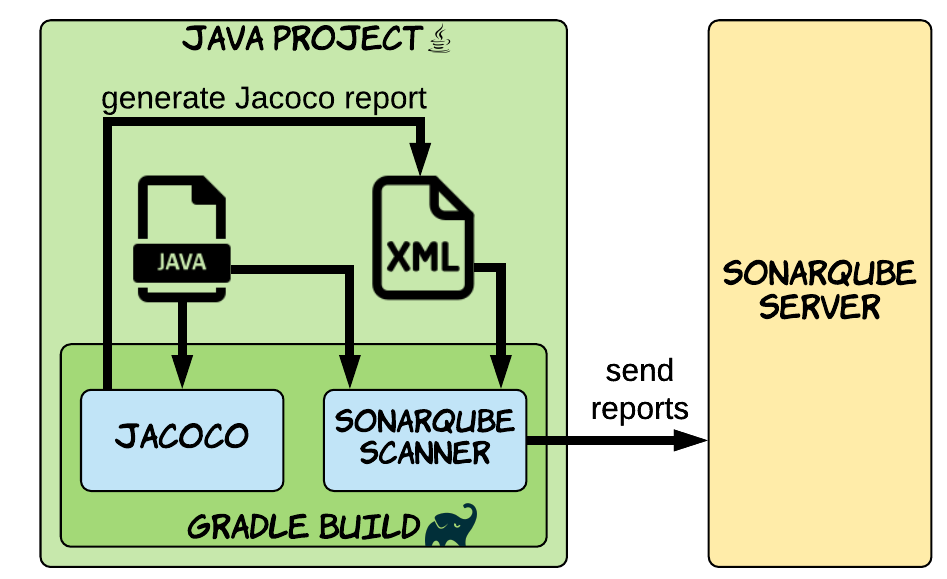
Generating code coverage data based on unit tests is straight forward in Gradle thanks to the jacoco plugin. The data can then be published to the static analysis tool SonarQube via the sonarqube plugin.
- Sonarqube Server must be running
- Generate Code Coverage Using Jacoco
For maven : By Building the project using cmd : mvn clean install
Look, on the coverage report under the target folder, there is a file called jacoco-unit.exec. That file who used by Sonarqube to generate and display a report about code coverage.
For gradle: ./gradlew clean build and then we run ./gradlew jacocoTestReport an XML report is produced at build/reports/jacoco/test/jacocoTestReport.xml.
The XML file contains detailed code coverage data.
- Publish report to sonar
For maven: execute this maven command to connect with Sonarqube and publish the result
mvn sonar:sonar
For Gradle: ./gradlew sonarqube to send the test coverage data to SonarQube.
How to integrate sonarqube scanner plugin with jenkins
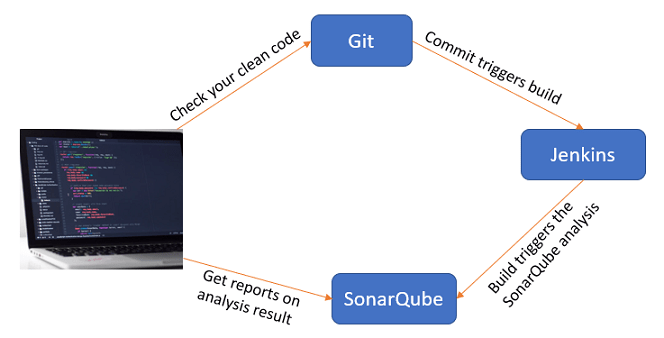
Assume a Scenario: After I committed code to GitHub. I want to ensure my code quality, and know bugs, vulnerabilities, code smells, etc. (static code analysis) for my code before I build my code automatically with Jenkins and I want this activity to perform every time I commit code.
In this scenario for Continuous Inspection and Continuous Integration of the code. We will follow the best practice using GitHub-Jenkins-SonarQube Integration for this scenario.
Flow: As soon as the developer commits the code to GitHub, Jenkins will fetch/pull the code from the repository and will perform static code analysis with help of Sonar Scanner and send analysis report to SonarQube Server then it will automatically build the project code.
Step 1 : Install SonarQube Scanner plugin – version 2.11 or later is required to integrate jenkins with sonarqube.
- From the Jenkins Dashboard, navigate to Manage Jenkins > Manage Plugins and install the SonarQube Scanner plugin.
- Back at the Jenkins Dashboard, navigate to Credentials > System from the left navigation.
- Click the Global credentials (unrestricted) link in the System table.
- Click Add credentials in the left navigation and add the following information:
- Kind: Secret Text
- Scope: Global
- Secret: Generate a token at User > My Account > Security in SonarQube, and copy and paste it here.
- Click OK.
- From the Jenkins Dashboard, navigate to Manage Jenkins > Configure System.
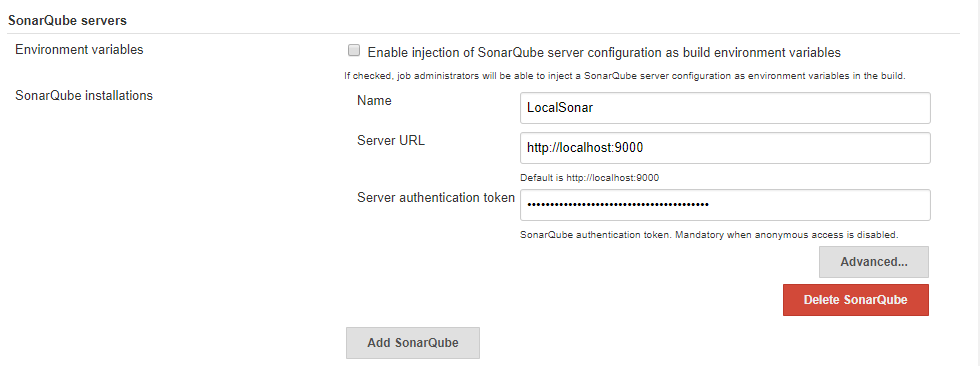
- From the SonarQube Servers section, click Add SonarQube. Add the following information:
- Name: Give a unique name to your SonarQube instance.
- Server URL: Your SonarQube instance URL.
- Credentials: Select the credentials created during step 4.
“OR”
Skip step 4 and – Go to Manage Jenkins > Configure system > SonarQube server section > Add SonarQube > Name it, provide Server Url as http://<IP>:<port> > and authentication token copied from SonarQube Server > Apply
- Click Save
Step 2 : Configure Sonar Scanner in Jenkins :
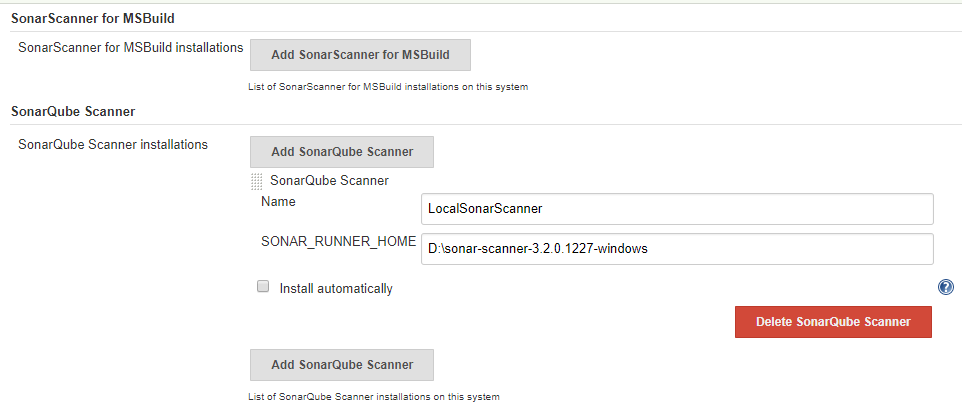
Go to Mange Jenkins > Global Tool Configuration > Scroll for SonarQube Scanner > Add sonar scanner > name it, uncheck if you already have sonar else it will automatically download for you and your sonar scanner setup will be done(in my case I already have) > provide path to sonar runner home as in below image
Step 3. Create a Job
New Item > Name and select a project type (in my case I am selecting Maven project you can opt for freestyle as well)
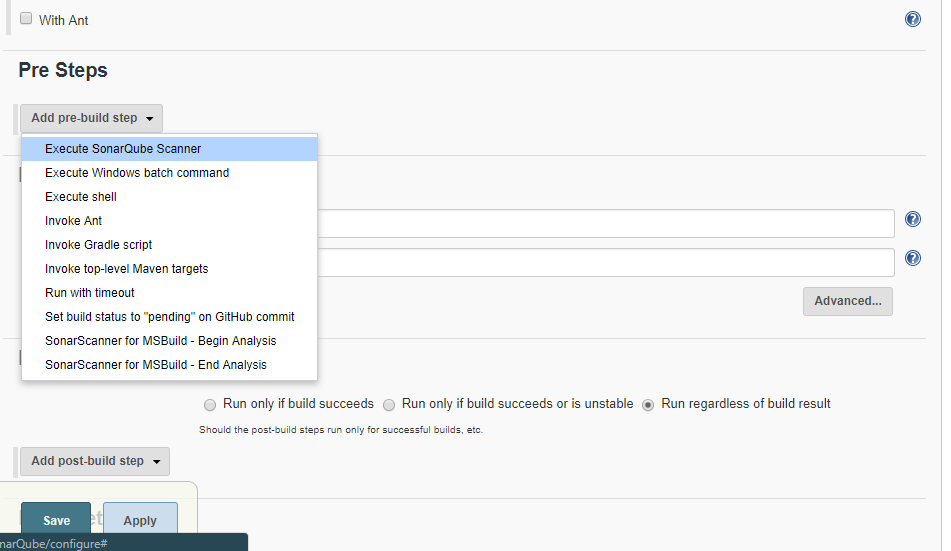
Set Git under SCM section and use * * * * * for Poll SCM under Build Trigger section. Under Build Environment section add pre-buid step > select Execute SonarQube Scanner
Step 4. Create a .properties file
Create a .properties file at any location and provide path on the task as below(I have created it in Jenkins workspace folder). This property file will be project specific. It contains certain sonar properties like which folder to scan, which folder to exclude in scanning, what is the project key and many more you can see it from https://docs.sonarqube.org/display/SCAN/Analyzing+with+SonarQube+Scanner
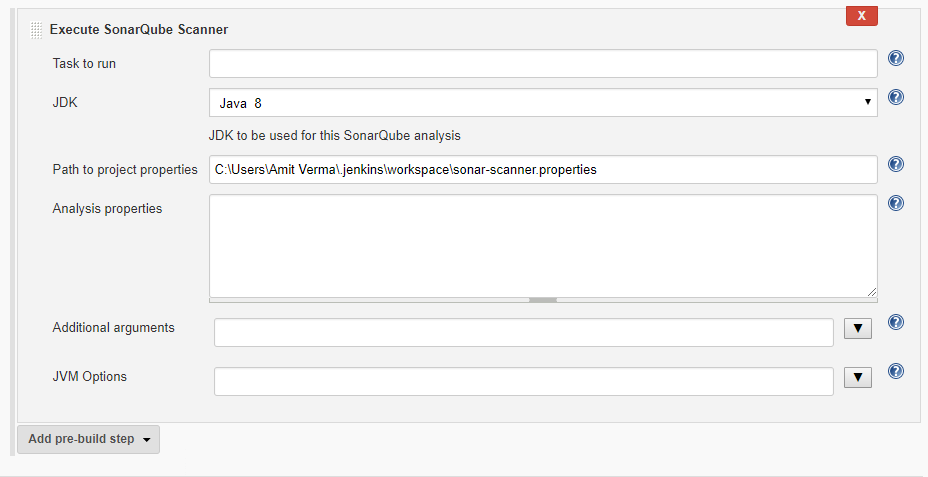
Inside sonar-scanner.properties write below code —
sonar.projectKey=github-jenkins-sonar
sonar.sources=./src
To keep it simple I have used only two properties(as above), sonar.projectKey property will create a project inside your SonarQube server with the same name if project don’t exist else it will append analysis to it, sonar.sources defines that which folder to scan. You can provide either a relative path from your Jenkins Job workspace or an actual path to the folder you want to scan.
Step 5. Build the job.
After successful build if you can see build logs it will show you the files and folder it has scanned and after scanning it has posted the analysis report to SonarQube Server you have integrated.
From job dashboard, click on sonar icon or navigate to Sonar server click on Projects (on header) you will see a new project with same project key you have given in sonar-scanner.properties file. Now you can go inside your project and analyse the report
