Welcome to Zabbix Questions and Answers!
Dive into the ultimate hub for Zabbix enthusiasts, where your questions find solutions and your ideas spark innovation. Whether you’re a beginner setting up your first Zabbix instance or a pro seeking advanced insights, this is your go-to space. Explore expert tips, troubleshoot challenges, and discover best practices to optimize your monitoring like never before. Join a thriving community of IT professionals and unlock the full potential of Zabbix today!
Why do we need a Monitoring Application?
- Information gathering
The large application produces a humongous number of data that should be monitored and analyzed for the performance and improvement of products and thereby better business.
- Around-the-clock monitoring
Humans will never be able to monitor each server 24 X 7. But it is very crucial that any unexpected incident on the servers should be notified and acted on it immediately.
- Pre-emptive Alerting
A monitoring tool is an invisible team member who will alert you about unexpected things in the system.
What is Zabbix?
Zabbix is an open-source network monitoring tool. Zabbix uses the client-server architecture and a small agent on the monitored client to gather data and send it to the Zabbix server.
Zabbix is defined as an open-source monitoring tool used for monitoring servers, networks, IT components, cloud services, and virtual machines. The Zabbix monitoring tool is used to provide the monitoring metrics and monitor the network utilization, consumption of disk space, and CPU load. The tool supports various operating systems like Mac OS, Solaris, Linux, and many more. The tool uses a different database to store the data and monitor the applications. The Zabbix monitoring tool is developed in C programming language, and PHP language is used for the web frontend.
Why Choose Zabbix?
- Open Source – Zabbix is purely open source and comes at no cost.
- Active Monitoring – You can easily monitor servers, applications, and network devices, gathering accurate statistics and performance data
- Enterprise ready – Zabbix has been designed to scale from small environments to large environments
- Capacity Planning – With the data collected by Zabbix, you will be easy to analyze your infrastructure and plan the capacity accordingly.
Other features are:
1. Data gathering
2. Real-time graphing
3. Web monitoring
4. Network discovery
5. Audit logging
6. Easy configuration
7. Agent-less monitoring
8. Web interface
9. Extensive visualisation options
10. JMX monitoring
Explain Zabbix Architecture
Zabbix is distributed monitoring tool with a central web interface. The simple architecture of Zabbix can be composed of three servers.
- Web Server
- RDBMS Server
- Zabbix server
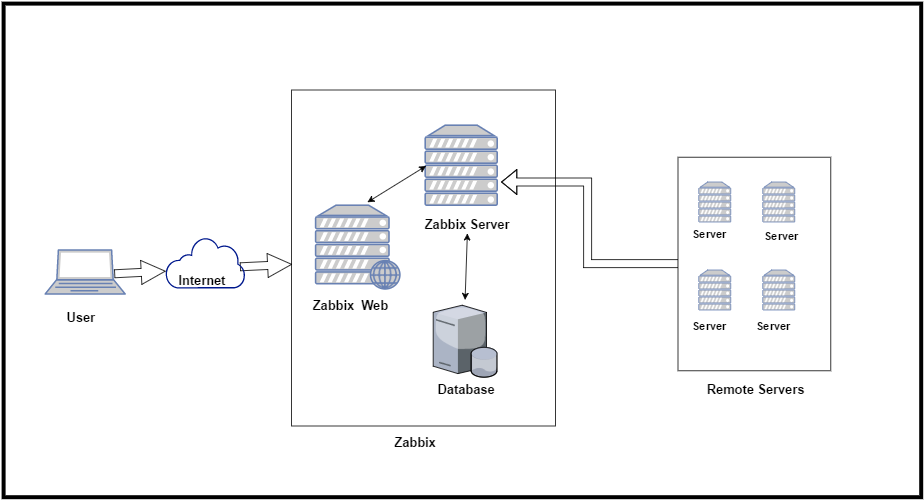
Zabbix consists of several major software components. These components and their features are outlined below.
Server: The Zabbix server is the central component to which agents report availability and integrity information and statistics. The server is the central repository in which all configuration, statistical and operational data is stored.
Database storage: All configuration information as well as the data gathered by Zabbix is stored in a database.
Web interface: For easy access to Zabbix from anywhere and from any platform, a Web based interface is provided. The interface is part of the Zabbix server and usually (but not necessarily) runs on the same physical machine as the one running the server.
Proxy: The Zabbix proxy can collect performance and availability data on behalf of the Zabbix server. A proxy is an optional part of the Zabbix deployment; however, deploying it may be very beneficial to distribute the load of a single Zabbix server.
Agent: Zabbix agents are deployed on monitoring targets to actively track local resources and applications, and report the gathered data to the Zabbix server.
Some of the terminologies of Zabbix.
- Frontend – Web interface provided with Zabbix
- Zabbix Server – Central server to collect the data and process it.
- Zabbix agent – A process deployed on client servers to monitor locally
- Host – A networked device that should be monitored
- Host group – A logical group of hosts. It is used when assigning access rights.
- Template – A set of entities (items, triggers, applications, low-level discovery rules, graphs, screens, web scenarios) ready to be applied to one or several hosts
- Item – Data that you want to receive from a host
- Trigger – It is a logical expression that defines a threshold
- Event – Occurrence of something that deserves attention
- Action – Predefined way of reacting to an event.
Explain the NOTIFICATION AND REMEDIATION of Zabbix
– Be notified in case of any issues, guaranteed
Inform responsible persons about occurred events using many different channels and options: 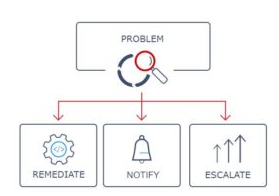
- Send messages
- Let Zabbix fix issues automatically
- Escalate problems according to flexible user-defined Service Levels
- Customize messages based on recipient’s role
Why do we need an agent to monitor hosts?
The agent is used to collect data from the host and send it back to the Zabbix server. The agent also allows for the execution of remote commands on the host, which can be used for automation purposes.
How are events handled in Zabbix?
Zabbix uses a number of ways to handle events, depending on the type and severity of the event. For example, for small events, Zabbix may simply write a message to the log file. For more serious events, Zabbix may send out an email or SMS alert.
What is the best way to integrate Zabbix with a ticketing system like JIRA?
The best way to integrate Zabbix with JIRA is to use the Zabbix API. This will allow you to create a custom integration that can automatically create tickets in JIRA when certain events occur in Zabbix.
What is the purpose of a trigger in Zabbix?
A trigger is a Zabbix feature that can be used to automatically generate alerts or perform some other action when a certain condition is met. Triggers can be based on any monitored value, including items, events, and alerts.
Is it possible to send alerts via email, SMS, or push notifications in Zabbix? If yes, then how?
Yes, it is possible to send alerts via email, SMS, or push notifications in Zabbix. You can configure each type of notification in the Zabbix frontend under Administration -> Media types. For email notifications, you will need to specify the SMTP server details. For SMS notifications, you will need to specify the SMS gateway details. For push notifications, you will need to specify the URL of the push notification service.
What happens if you don’t specify a proxy server for host discovery?
If you don’t specify a proxy server for host discovery, then Zabbix will not be able to automatically discover any new hosts on your network. This means that you will need to manually add any new hosts that you want to monitor into Zabbix.
What are web scenarios in Zabbix? How can they be used?
Web scenarios are used in Zabbix to monitor websites and web-based applications. By creating a web scenario, you can specify a series of URLs that Zabbix will check, as well as the parameters that should be present in the responses. This can be used to make sure that a website is up and running, or to check for specific content that should be present on a page.
What is the default port number used by Zabbix Server?
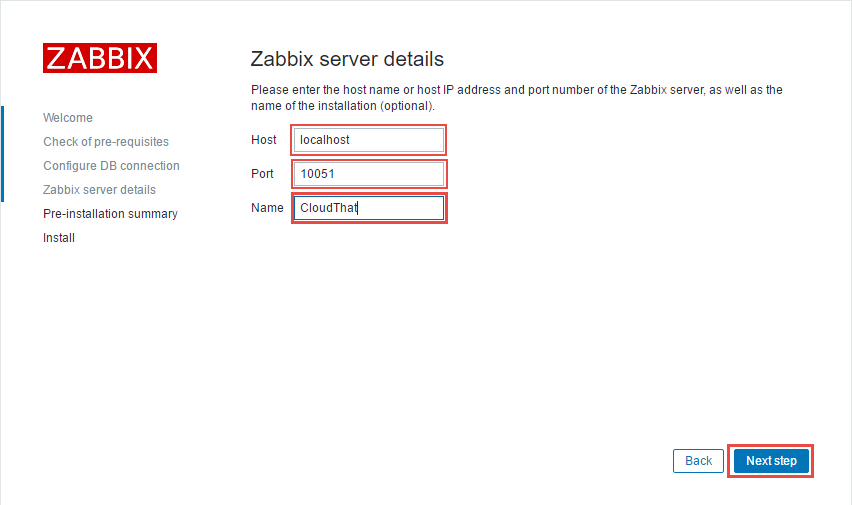
The default port number used by Zabbix Server is 10051.
What are the advantages of using Zabbix over other monitoring tools like Nagios?
Zabbix has a number of advantages over Nagios, including a more user-friendly interface, more comprehensive monitoring capabilities, and better scalability. Zabbix is also open source, which means it is free to use and modify, while Nagios is not.
What are some examples of macros that can be used in Zabbix?
Macros can be used in Zabbix for a variety of purposes, such as to insert the name of the host being monitored into a trigger expression, or to specify which users should be notified in the event of a problem. Some examples of macros that can be used in Zabbix are {HOSTNAME}, {IPADDRESS}, {TRIGGER.NAME}, and {TRIGGER.STATUS}.
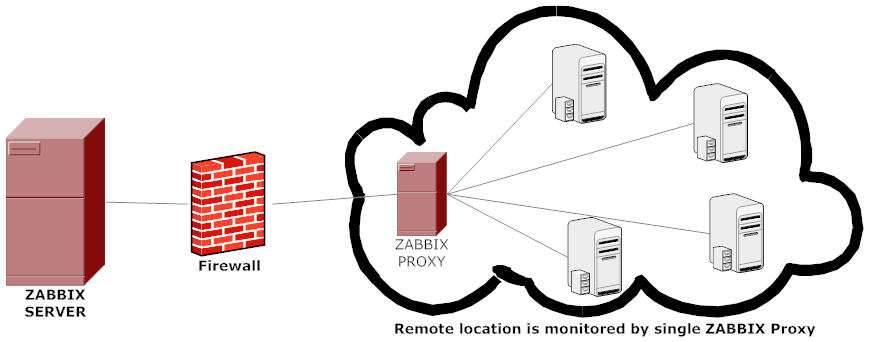
What is Zabbix proxy?
Zabbix proxy is a process that may collect monitoring data from one or more monitored devices and send the information to the Zabbix server, essentially working on behalf of the server. All collected data is buffered locally and then transferred to the Zabbix server the proxy belongs to.
Deploying a proxy is optional, but may be very beneficial to distribute the load of a single Zabbix server. If only proxies collect data, processing on the server becomes less CPU and disk I/O hungry.
A Zabbix proxy is the ideal solution for centralized monitoring of remote locations, branches and networks with no local administrators.
Zabbix proxy requires a separate database.
Zabbix Proxy can be used for many purposes:
- Offload Zabbix Server when monitoring thousands of devices
- Monitor remote locations
- Monitor locations having unreliable communications
- Simplify maintenance of distributed monitoring
Is Prometheus better than Zabbix?
Prometheus is faster because of the database and Zabbix has a smaller footprint (because it’s written in C). In Zabbix, you can do most things in the web GUI, but in Prometheus, you must edit files like in Nagios.
Which is better Nagios vs Zabbix?
After comparing the two it is clear that Zabbix is the winner. While Nagios Core has the basics in place to run effective network monitoring it simply doesn’t have the experience and configurability that Zabbix does. Zabbix is a free network monitor that performs like a product situated in the very top price bracket.
How do I monitor Kubernetes with Zabbix?
Installation
Copy k8s-stats.py to /etc/zabbix/scripts/ and k8s.conf to /etc/zabbix/zabbix_agentd.d/
Import Zabbix template (k8s-zabbix-template.xml) to Zabbix server.
Create zabbix user in Kubernetes (can use zabbix-user-example. yml) and set it’s token and API server url in k8s-stats.py.
Apply template to host.
How do I monitor Windows with Zabbix?
How to Add Windows Host to Zabbix Server for Monitoring
Step 1) Download Zabbix Agent for Windows Server. …
Step 2) Edit the Zabbix configuration file. …
Step 3) Install and start Zabbix Agent on Windows server. …
Step 4) Configure Windows firewall for Zabbix Agent. …
Step 5) Add a Windows host on Zabbix Server.
Can Zabbix monitor the cloud?
Zabbix has the advantage of being able to monitor not only on-premises but also cloud and virtual environments in an integrated manner. Whereas the standard Amazon CloudWatch is limited to monitoring AWS resources (CPU, memory, etc.), Zabbix allows you to monitor even the state of your applications in detail.
How do I restart Zabbix on Centos 7?
Now you can start the Zabbix agent and set it to start at boot time:
sudo systemctl start zabbix-agent.
sudo systemctl enable zabbix-agent.
How do I connect my Zabbix agent to Zabbix server?
Connect Zabbix agent to Zabbix server
Log in to the Zabbix frontend and go to Configuration > Hosts > Create Host. Enter the hostname for the device you are adding. This must match the hostname you configured in the agent.
Steps to Install and configure Zabbix
Steps to install and configure Zabbix 3.0. I’m going to use one Redhat machine for all the three components. That are Zabbix Web, Zabbix Server and Database.
Login to your Redhat machine and install required packages.
#yum install httpd httpd-devel
#yum install mysql mysql-server
#yum install php php-cli php-common php-devel php-pear php-gd php-mbstring php-mysql php-xml php-bcmath
#service httpd start
#service mysqld start
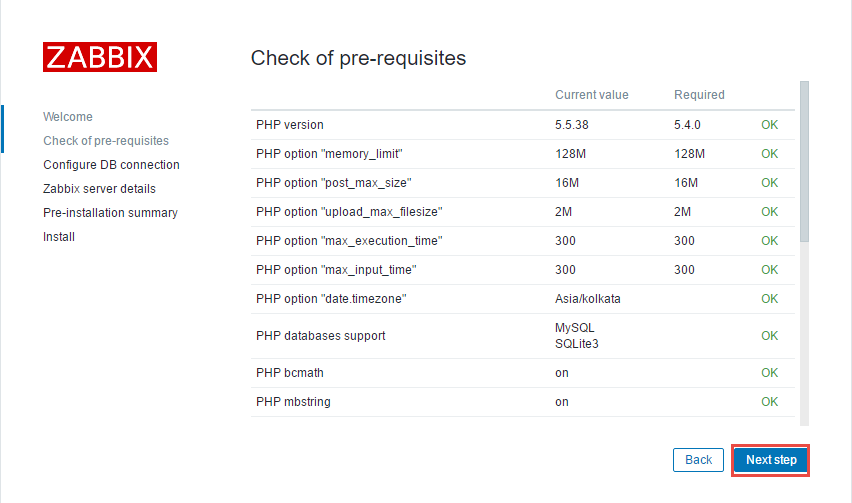
Note: Zabbix 3.0 require PHP 5.4 later
- Configure mysql
#mysql_secure_installation
- Configure yum repository to install Zabbix
CentOS/RHEL 7:
# rpm -Uvh http://repo.zabbix.com/zabbix/3.0/rhel/7/x86_64/zabbix-release-3.0-1.el7.noarch.rpm
CentOS/RHEL 6:
# rpm -Uvh http://repo.zabbix.com/zabbix/3.0/rhel/6/x86_64/zabbix-release-3.0-1.el6.noarch.rpm
CentOS/RHEL 5:
# rpm -Uvh http://repo.zabbix.com/zabbix/3.0/rhel/5/x86_64/zabbix-release-3.0-1.el5.noarch.rpm
- Install Zabbix server
# yum update
# yum install zabbix-server-mysql zabbix-web-mysql zabbix-agent zabbix-java-gateway
- Configure apache
Open httpd.conf and add a virtual host entry for zabbix
#vi /etc/httpd/conf/httpd.conf
Append following content in the file and save it
<VirtualHost *:80>
ServerAdmin admin@zabbix.example.com
DocumentRoot /usr/share/zabbix
ServerName zabbix.example.com
ErrorLog logs/zabbix.example.com-error_log
</VirtualHost>
- Configure database for Zabbix
Create a user and database for zabbix.
# mysql -u root -p
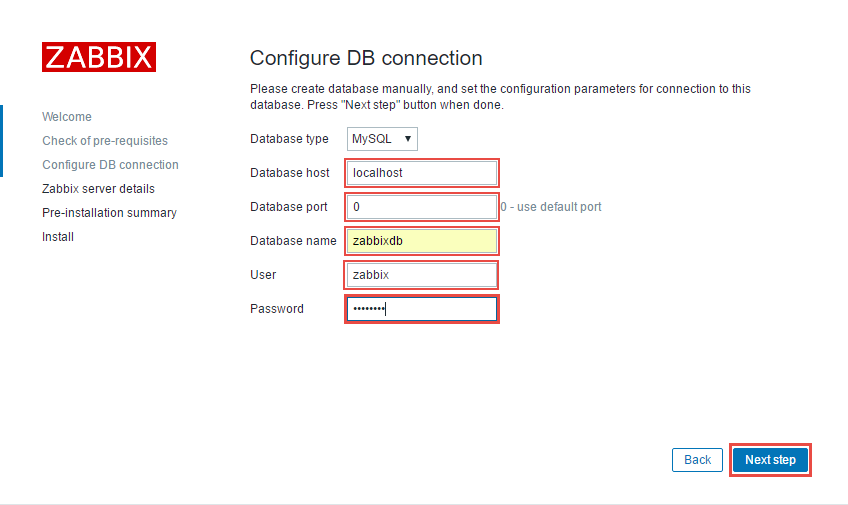
mysql> CREATE DATABASE zabbixdb CHARACTER SET UTF8;
mysql> GRANT ALL PRIVILEGES on zabbixdb.* to zabbix@localhost IDENTIFIED BY ‘password’;
mysql> FLUSH PRIVILEGES;
mysql> quit
After creating database restore the default mysql database provided by zabbix
#cd /usr/share/doc/zabbix-server-mysql-3.0.7/
#gunzip create.sql.gz
#mysql -u zabbix -p –database zabbixdb < create.sql
- Disable SELinux and Start Zabbix Server
# setenforce 0
# service zabbix-server start
- Start your Zabbix web installer
Web installer can be accessed from your web browser using your machine’s FQDN or Public IP.
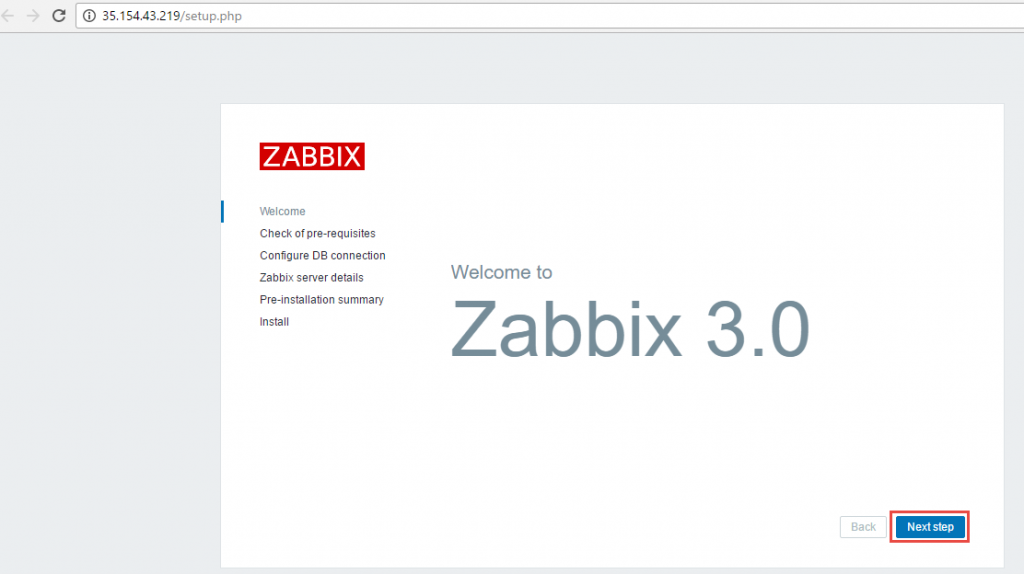
- Check for pre-requeisites
Check if you meet all the system requirements. If not configure your php.ini.
- Configure DB Connection
Fill your DB details which you created and click on Next Step
- Zabbix server details
Edit your server details
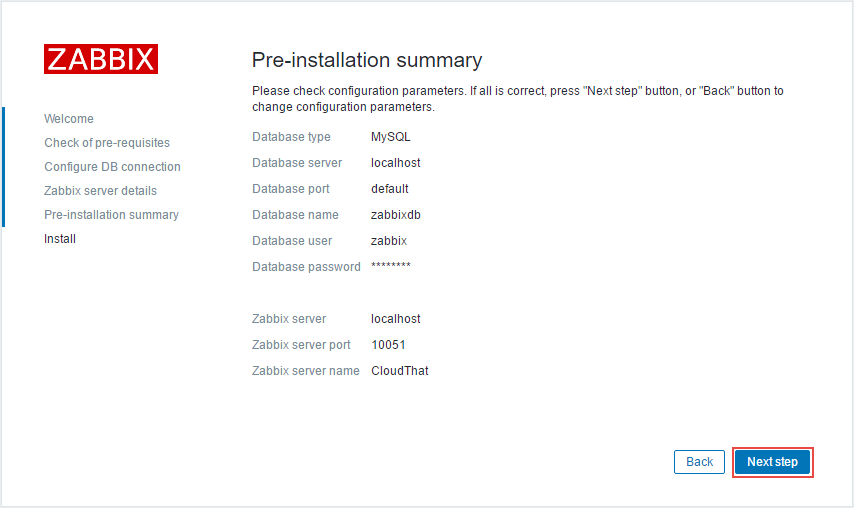
- Pre-Installation Summary
This will give you a summary of your configuration. Click on Next Step
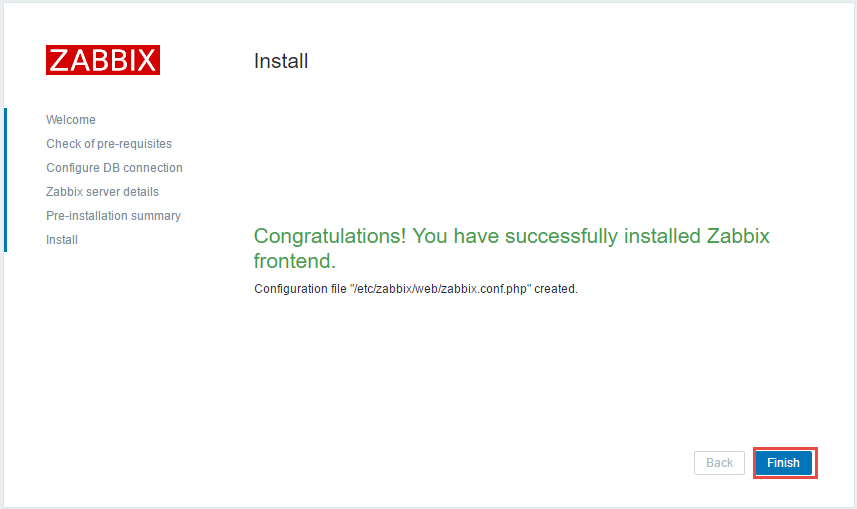
- Install Zabbix frontend
Click on Finish button to install Zabbix frontend server
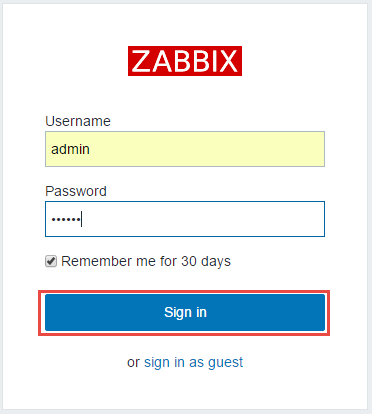
- Login to Zabbix
Login to Zabbix with following credentials
UserName: Admin
Password: Zabbix
You will see your Zabbix home screen now 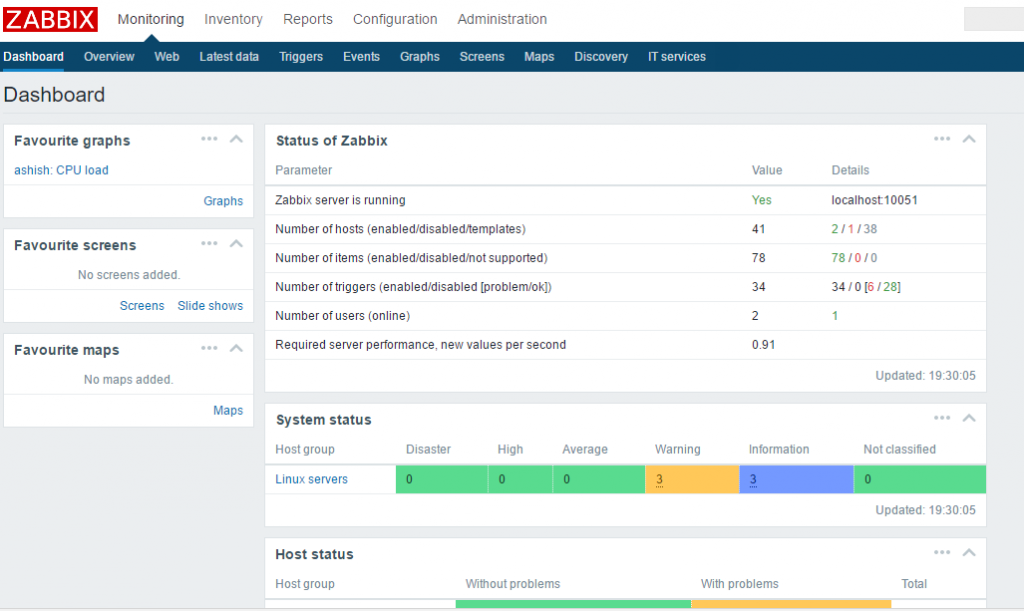
DevOps And Cloud Computing Course Online